Modelo com Múltiplas Entradas
Exemplo criado por Wilson Rocha Lacerda Junior
Procurando mais detalhes sobre modelos NARMAX? Para informações completas sobre modelos, métodos e uma ampla variedade de exemplos e benchmarks implementados no SysIdentPy, confira nosso livro: Nonlinear System Identification and Forecasting: Theory and Practice With SysIdentPy
Este livro oferece orientação aprofundada para apoiar seu trabalho com o SysIdentPy.
Gerando dados de amostra com 2 entradas e 1 saída
Os dados são gerados simulando o seguinte modelo:
\(y_k = 0.4y_{k-1}^2 + 0.1y_{k-1}x1_{k-1} + 0.6x2_{k-1} -0.3x1_{k-1}x2_{k-2} + e_{k}\)
Se colored_noise for definido como True:
\(e_{k} = 0.8\nu_{k-1} + \nu_{k}\)
onde \(x\) é uma variável aleatória uniformemente distribuída e \(\nu\) é uma variável com distribuição gaussiana com \(\mu=0\) e \(\sigma=0.001\)
import numpy as np
import pandas as pd
import matplotlib.pyplot as plt
from sysidentpy.model_structure_selection import FROLS
from sysidentpy.basis_function import Polynomial
from sysidentpy.parameter_estimation import LeastSquares
from sysidentpy.metrics import root_relative_squared_error
from sysidentpy.utils.display_results import results
from sysidentpy.utils.plotting import plot_results
from sysidentpy.utils.generate_data import get_miso_data
x_train, x_valid, y_train, y_valid = get_miso_data(
    n=1000, colored_noise=False, sigma=0.001, train_percentage=90
)
Existe uma diferença específica para dados com múltiplas entradas.
- Você precisa passar os lags para cada entrada em uma lista aninhada (e.g., [[1, 2], [1, 2]])
As demais configurações permanecem as mesmas.
Construindo o modelo
basis_function = Polynomial(degree=2)
estimator = LeastSquares()

model = FROLS(
    order_selection=True,
    n_terms=4,
    ylag=2,
    xlag=[[1, 2], [1, 2]],
    info_criteria="aic",
    estimator=estimator,
    basis_function=basis_function,
    err_tol=None,
)
<sysidentpy.model_structure_selection.forward_regression_orthogonal_least_squares.FROLS at 0x1a88cc17350>
Avaliação do modelo
yhat = model.predict(X=x_valid, y=y_valid)
rrse = root_relative_squared_error(y_valid, yhat)
print(rrse)
r = pd.DataFrame(
results(
model.final_model,
model.theta,
model.err,
model.n_terms,
err_precision=8,
dtype="sci",
),
columns=["Regressors", "Parameters", "ERR"],
)
print(r)
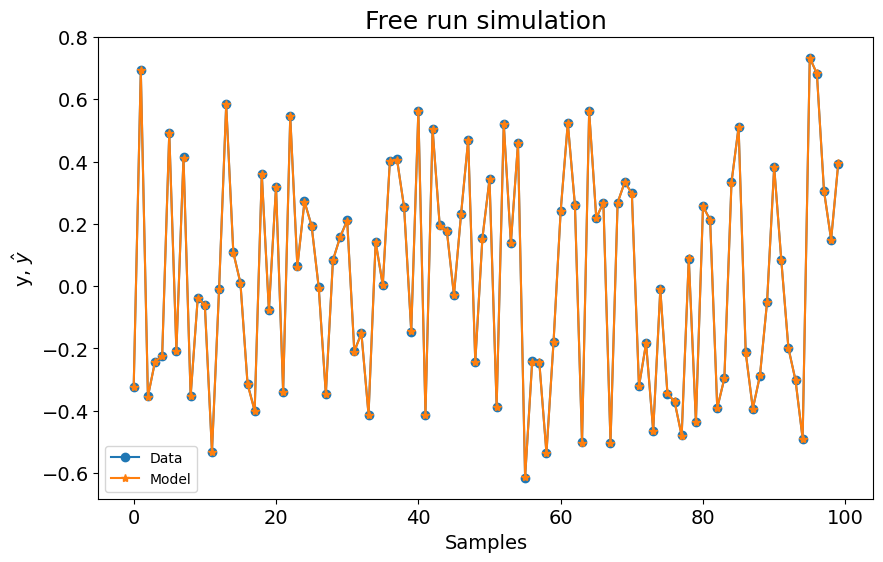
plot_results(y=y_valid, yhat=yhat, n=1000)
0.00314141814133057
       Regressors   Parameters             ERR
0         x2(k-1)   5.9999E-01  9.15006949E-01
1  x2(k-2)x1(k-1)  -3.0010E-01  4.31748224E-02
2        y(k-1)^2   3.9976E-01  4.15131661E-02
3   x1(k-1)y(k-1)   1.0028E-01  2.96827987E-04
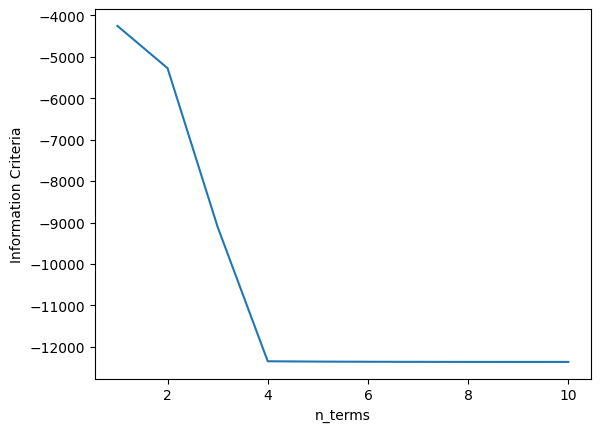
xaxis = np.arange(1, model.n_info_values + 1)
plt.plot(xaxis, model.info_values)
plt.xlabel("n_terms")
plt.ylabel("Information Criteria")
Text(0, 0.5, 'Information Criteria')